Nassau County Economic Indicators
The Chamber's commitment to fostering a robust and informed business community led us to introduce the Nassau County Economic Indicators Dashboard, a monthly publication offering a comprehensive lens into the economic pulse of Nassau County.
Each month, we gather a diverse range of statistics pertinent to the Nassau County business landscape, including new business registrations, housing trends, tourism figures, and a wide array of other essential data elements. Distinctively local in its focus, the Economic Indicators Dashboard stands as the sole monthly report of its kind in the area, equipping Chamber members with unparalleled insights to make decisions that resonate positively within our community. For a complete list of sources used for the Nassau County Economic Indicators Dashboard, click here.
A few of the statistics included in the monthly Economic Indicators Dashboard include:
Community
Each month, we report community statistics such as per capita income, poverty rate, the number of Nassau County children receiving free and reduced school lunch, and more. To the right, see an example from a previous edition of the Dashboard.
Employment
Each month, we report employment statistics for Nassau County including the unemployment rate, job growth rate, number of jobs year over year change, and number of new jobs needed by 2030. To the right, see an example from a previous edition of the Dashboard.
Education
Each month, we report education statistics such as the high school graduation rate, 3rd and 8th grade reading and math scores, educational attainment, and more. To the right, see an example from a previous edition of the Dashboard.
Housing
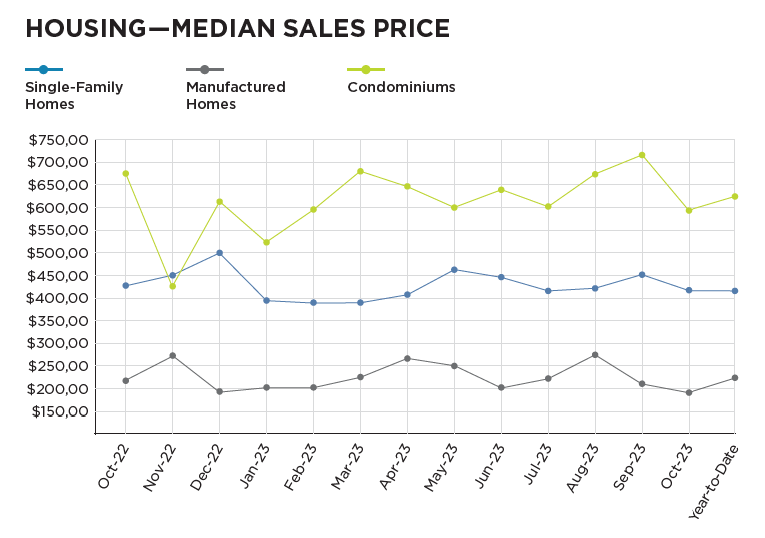
Each month, we report housing statistics such as regional monthly rent comparisons, median price of homes in Nassau County, the average number of days a home stays on the market in Nassau County, and more. To the right, see an example from a previous edition of the Dashboard.
Manufacturing
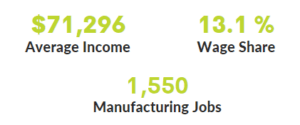
Each month, we report manufacturing statistics such as the average local manufacturing income, wage share percentage, number of local manufacturing jobs, and more. To the right, see an example from a previous edition of the Dashboard.
New Business
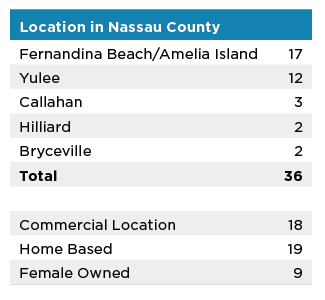
Each month, we report new business statistics including an overview of the number of new businesses throughout Nassau County and the number of new commercial, home-based, and female owned businesses. To the right, see an example from a previous edition of the Dashboard.
Port of Fernandina
Each month, we report statistics from the Port of Fernandina including year to date bulk cargo total tons, dockage days, vessel port calls, total rail cars, and more. To the right, see an example from a previous edition of the Dashboard.
Interested in receiving the Economic Indicators Dashboard each month?
The Nassau County Economic Indicators Dashboard is a resource that is exclusive to members of the Nassau County Chamber of Commerce. If you're a current member of the Chamber, click below to log in to your Info Hub portal. Here, you will be able to access every single edition of the Dashboard and compare vital Nassau County business statistics. If you are not a member of the Chamber, click below to sign up today.


